Analytics page
DDC allows you to fully analyze the usage patterns of your ovens, so that you can always be aware of how your ovens are used over a period of time.
All the aggregated data of your ovens are on the DDC analytics page.
Select ovens and time range
When you access the page you will automatically see the data of all your ovens for the previous 7 days.
If you prefer, you can choose some specific ovens to analyze by clicking the button SELECTED OVENS. This will open a pop-up where you can select all the ovens that you want to analyze, then click SEE ANALYTICS.
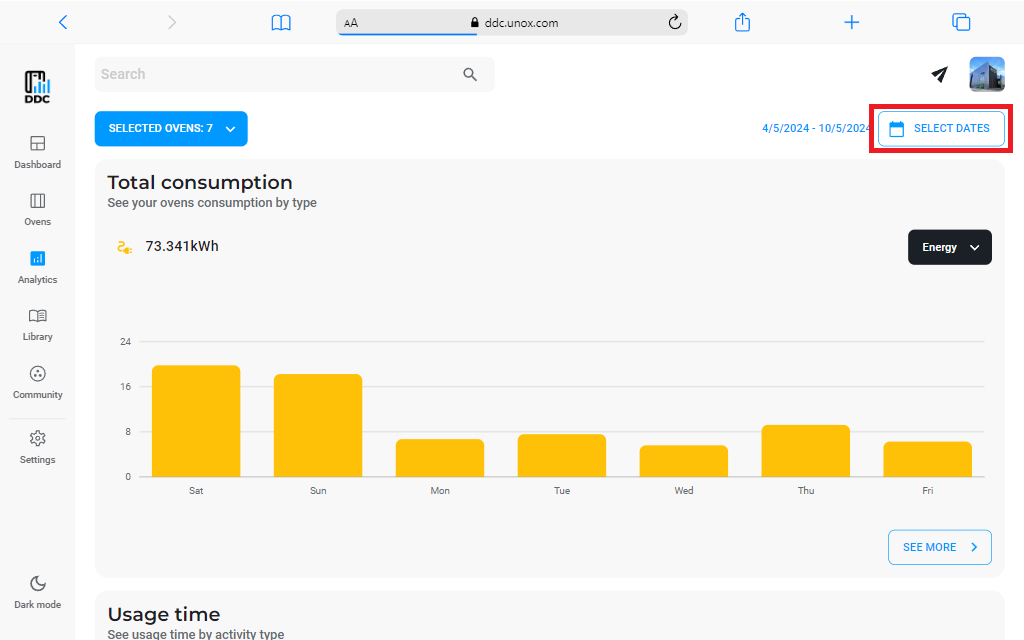
You can also select which period of time you want to consider: click the SELECT DATES button and choose a range of days using the picker.
Hovering a column will show a tooltip that reports further details about the column itself.
Total consumption
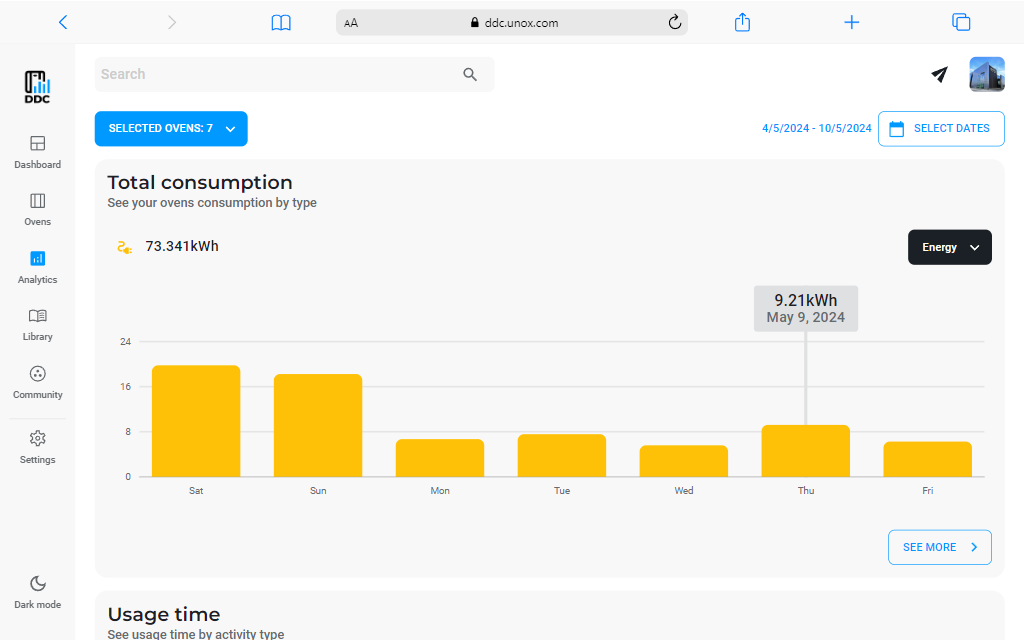
The first graph is the one that represents Total consumption of the selected ovens in the selected period of time.
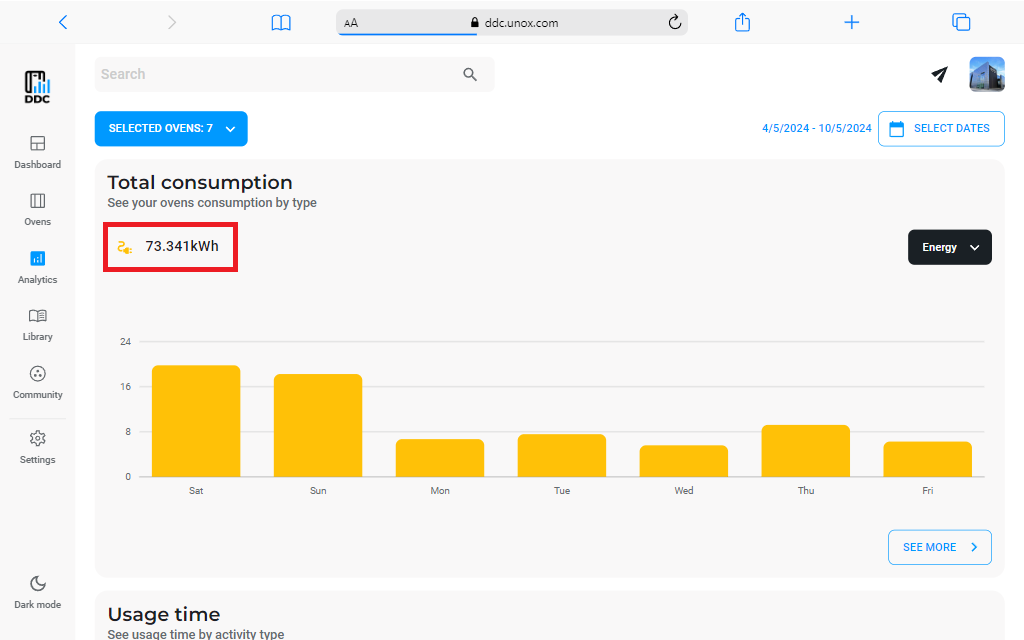
Inside the chart box, under the title, there is the value of the total consumption of your ovens in the selected period.
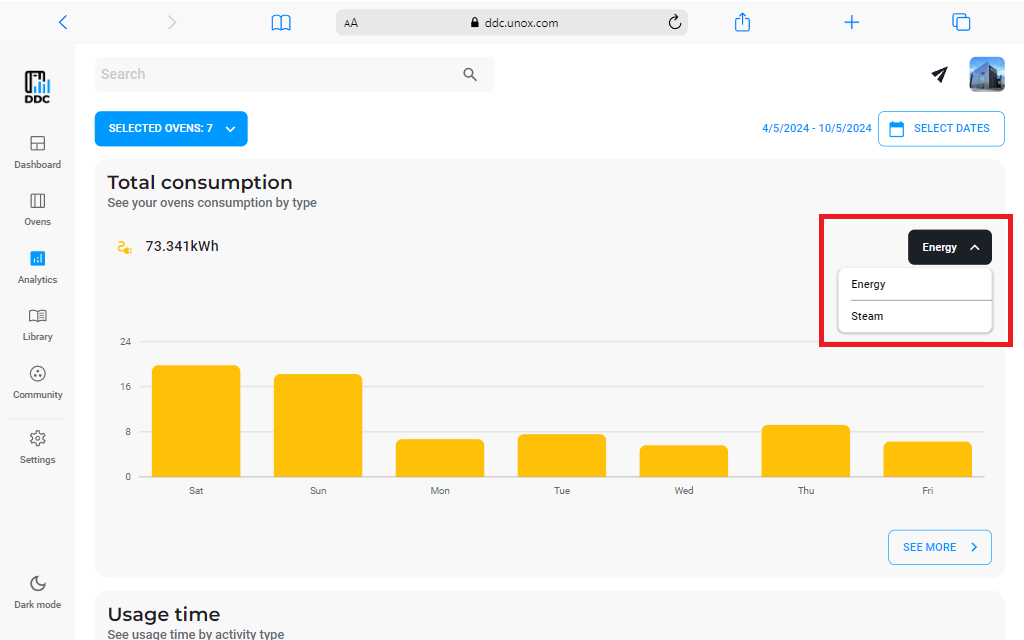
On the right, you can find a dropdown menu that allows you to select the specific consumption: you can choose among energy, steam water and gas (if you selected at least one gas oven).
Hovering a column will show a tooltip that reports further details about the consumption value and the period.
If you click the button SEE MORE, you will enter a drill-down page: here you have a table that shows you the consumption of every single oven in every single period represented by a column in the chart.
Click on a specific oven to enter its detail page.
Usage time
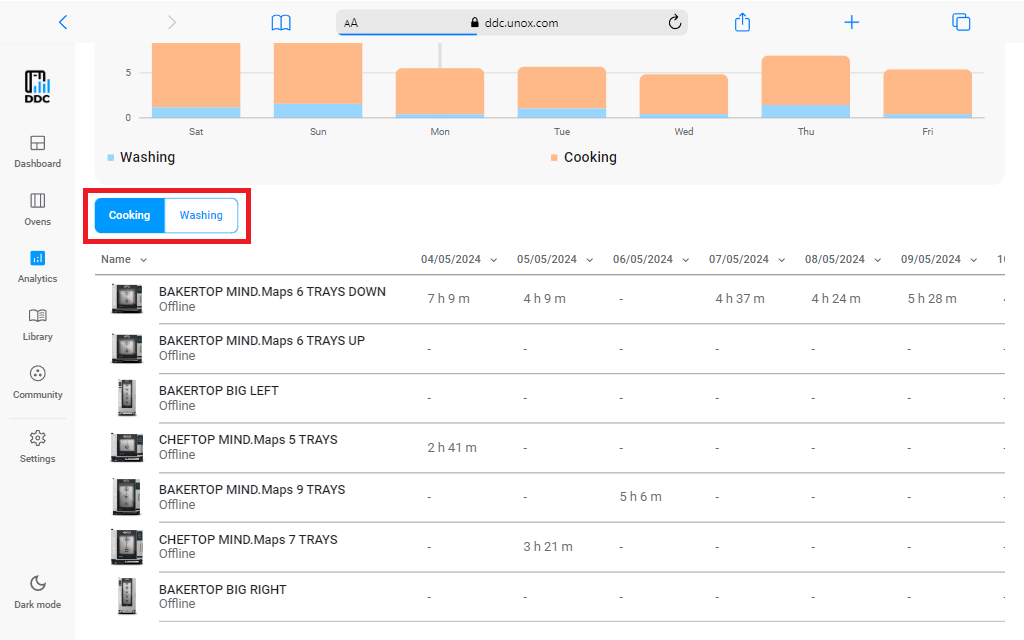
The usage time chart shows how many hours the ovens have worked and have been washed in the selected period of time.
The blue part of every column represents the washing time, and the orange part represents the cooking time. You can see the specific value in the tooltip that appears when you hover over a column.
Click SEE MORE to enter the drill-down page: the table under the graph shows for each oven and for each day the hours of cooking.
To see the hours of washing, use the tab bar just above the table.
Washing frequency
With washing frequency, you can monitor if your ovens are washed properly or not: on one side you don't want to keep them too dirty and on the other hand, you don't want to waste energy, water and detergent by cleaning them too often than required.
This data is available on the Washing frequency chart: light blue gives indications about the ovens washed too much, dark blue the ones that are not washed enough and pink represents the ovens that, on average, are washed properly (between 4-8 hours of cooking).
If you hover a column, you can see exactly how many ovens have been washed properly, too much and not enough for a specific day.
Furthermore, by clicking SEE MORE, you can access the drill-down page, which in this case shows you the washing frequency of every oven for each specific day.
Door opening time during cooking
Another element that influences your consumption is how much time your oven's door stays open during cooking.
Keeping this value as low as possible allows you to dissipate less heat and consequently consume less energy.
The Door opening time during cooking chart shows exactly how much time your ovens had the door opened while a cooking program was running.
Use the tooltip to see the detailed time of each day.
If you click SEE MORE, the drill-down page will be available to show you details for each oven so you can monitor which ones are used correctly and which are not.
Number of washed ovens
The last chart gives you detailed information about when during the day your ovens are washed in the selected period.
In the Number of washed ovens chart, you can see on the y-axis the number of ovens and on the x-axis the hours of the day.
With the tooltip, you can see the exact number of ovens washed in a certain hour.
Click SEE MORE to see the drill-down page. Here in the table, you can see for each oven in the selected period how many times it was washed at a certain hour of the day.